Model 01 · GoldBEAM
Ranked variants, with the reasoning attached
GoldBEAM reads 1,048,576 bp of human sequence and predicts its 3D contact map at 2,048 bp resolution. That map is the engine: each variant is scored by how much it changes the predicted contacts, and each score is traced back to the sequence context behind it. Scores are most reliable in GC- and CpG-rich sequence, where the model's attribution is strongest. No Hi-C data is needed at inference time.
01
Sequence in
Submit 1,048,576 bp of human DNA through the research TUI or portal. No experimental data required.
02
Variants scored
Each variant is ranked by how much it changes the predicted 448 × 448 contact map.
03
Context shown
Attribution shows the GC- and CpG-rich sequence behind each score, ready to check.
The name
Golden beams of truth
We picture the model's interpretability vectors as golden beams: lines of evidence running from a predicted contact back to the sequence that caused it. That is the point of the platform. A prediction you cannot explain is hard to trust and harder to publish.
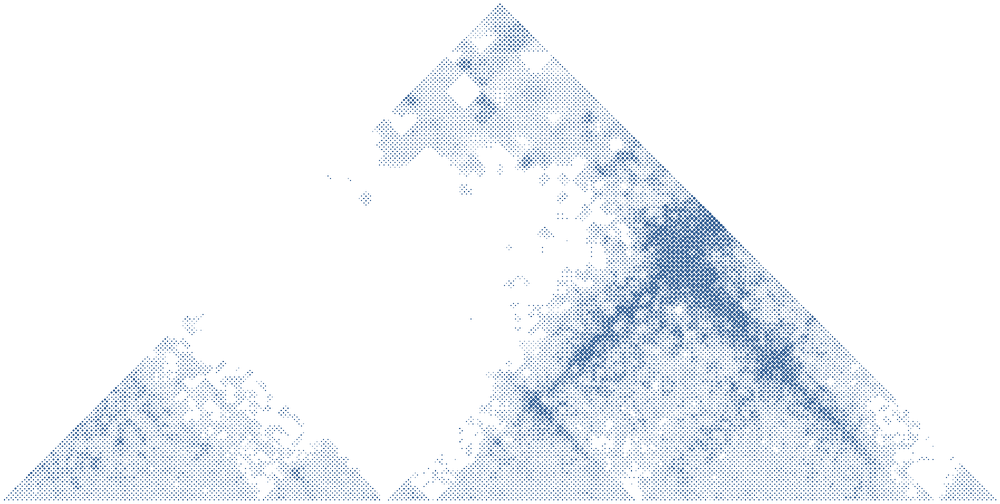
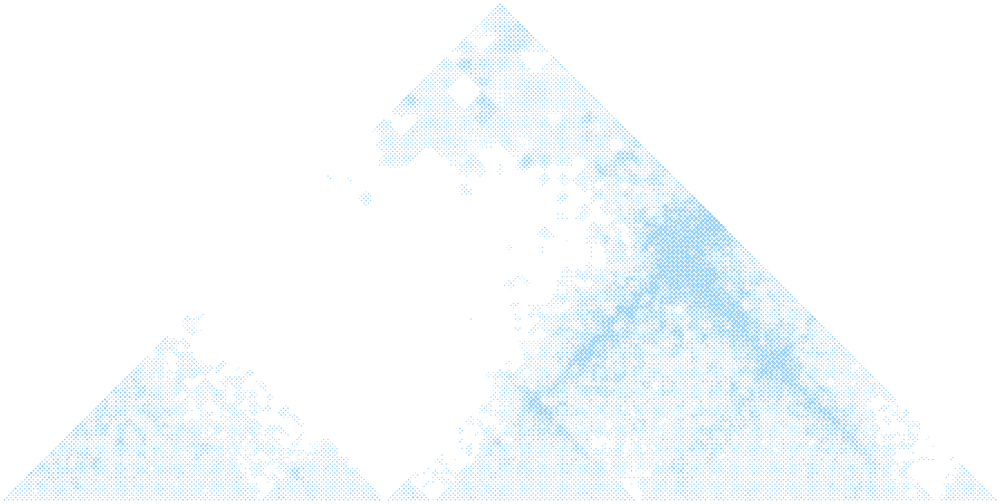
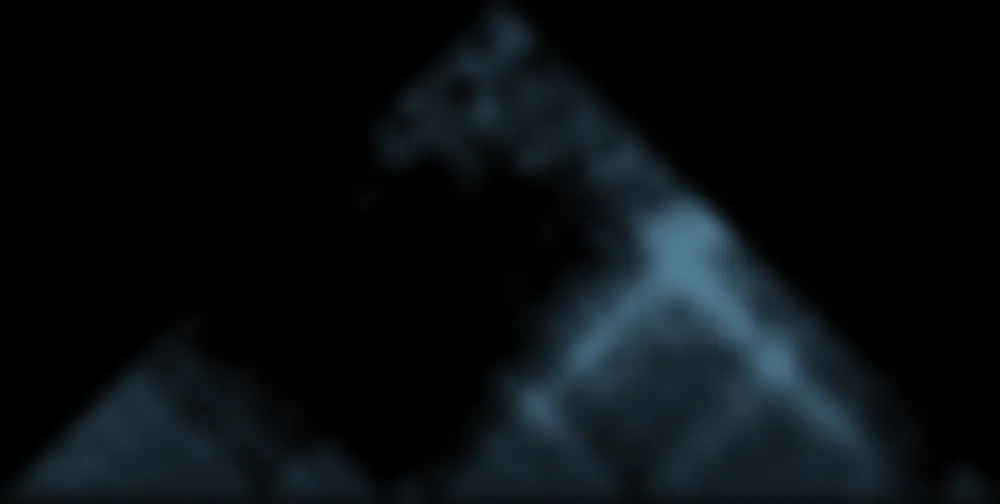
In a contact map, each pixel shows how often two stretches of the genome touch. The map here is real measured Hi-C, shown relative to what genomic distance alone would predict, so the domains stand out as blocks along the diagonal: TADs, the neighbourhoods where gene regulation happens.
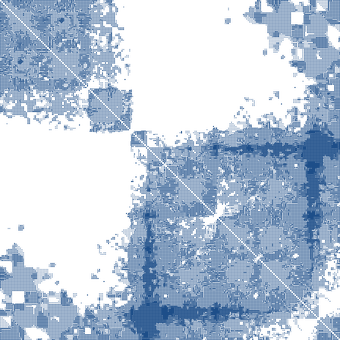
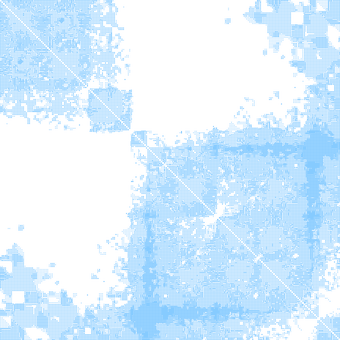
Measured Hi-C from HFF cells (DNALongBench validation data) at GoldBEAM's output resolution: 448 × 448 bins of 2,048 bp. Experimental data, not a GoldBEAM prediction.
Research Suite
A full interpretability lab in your terminal
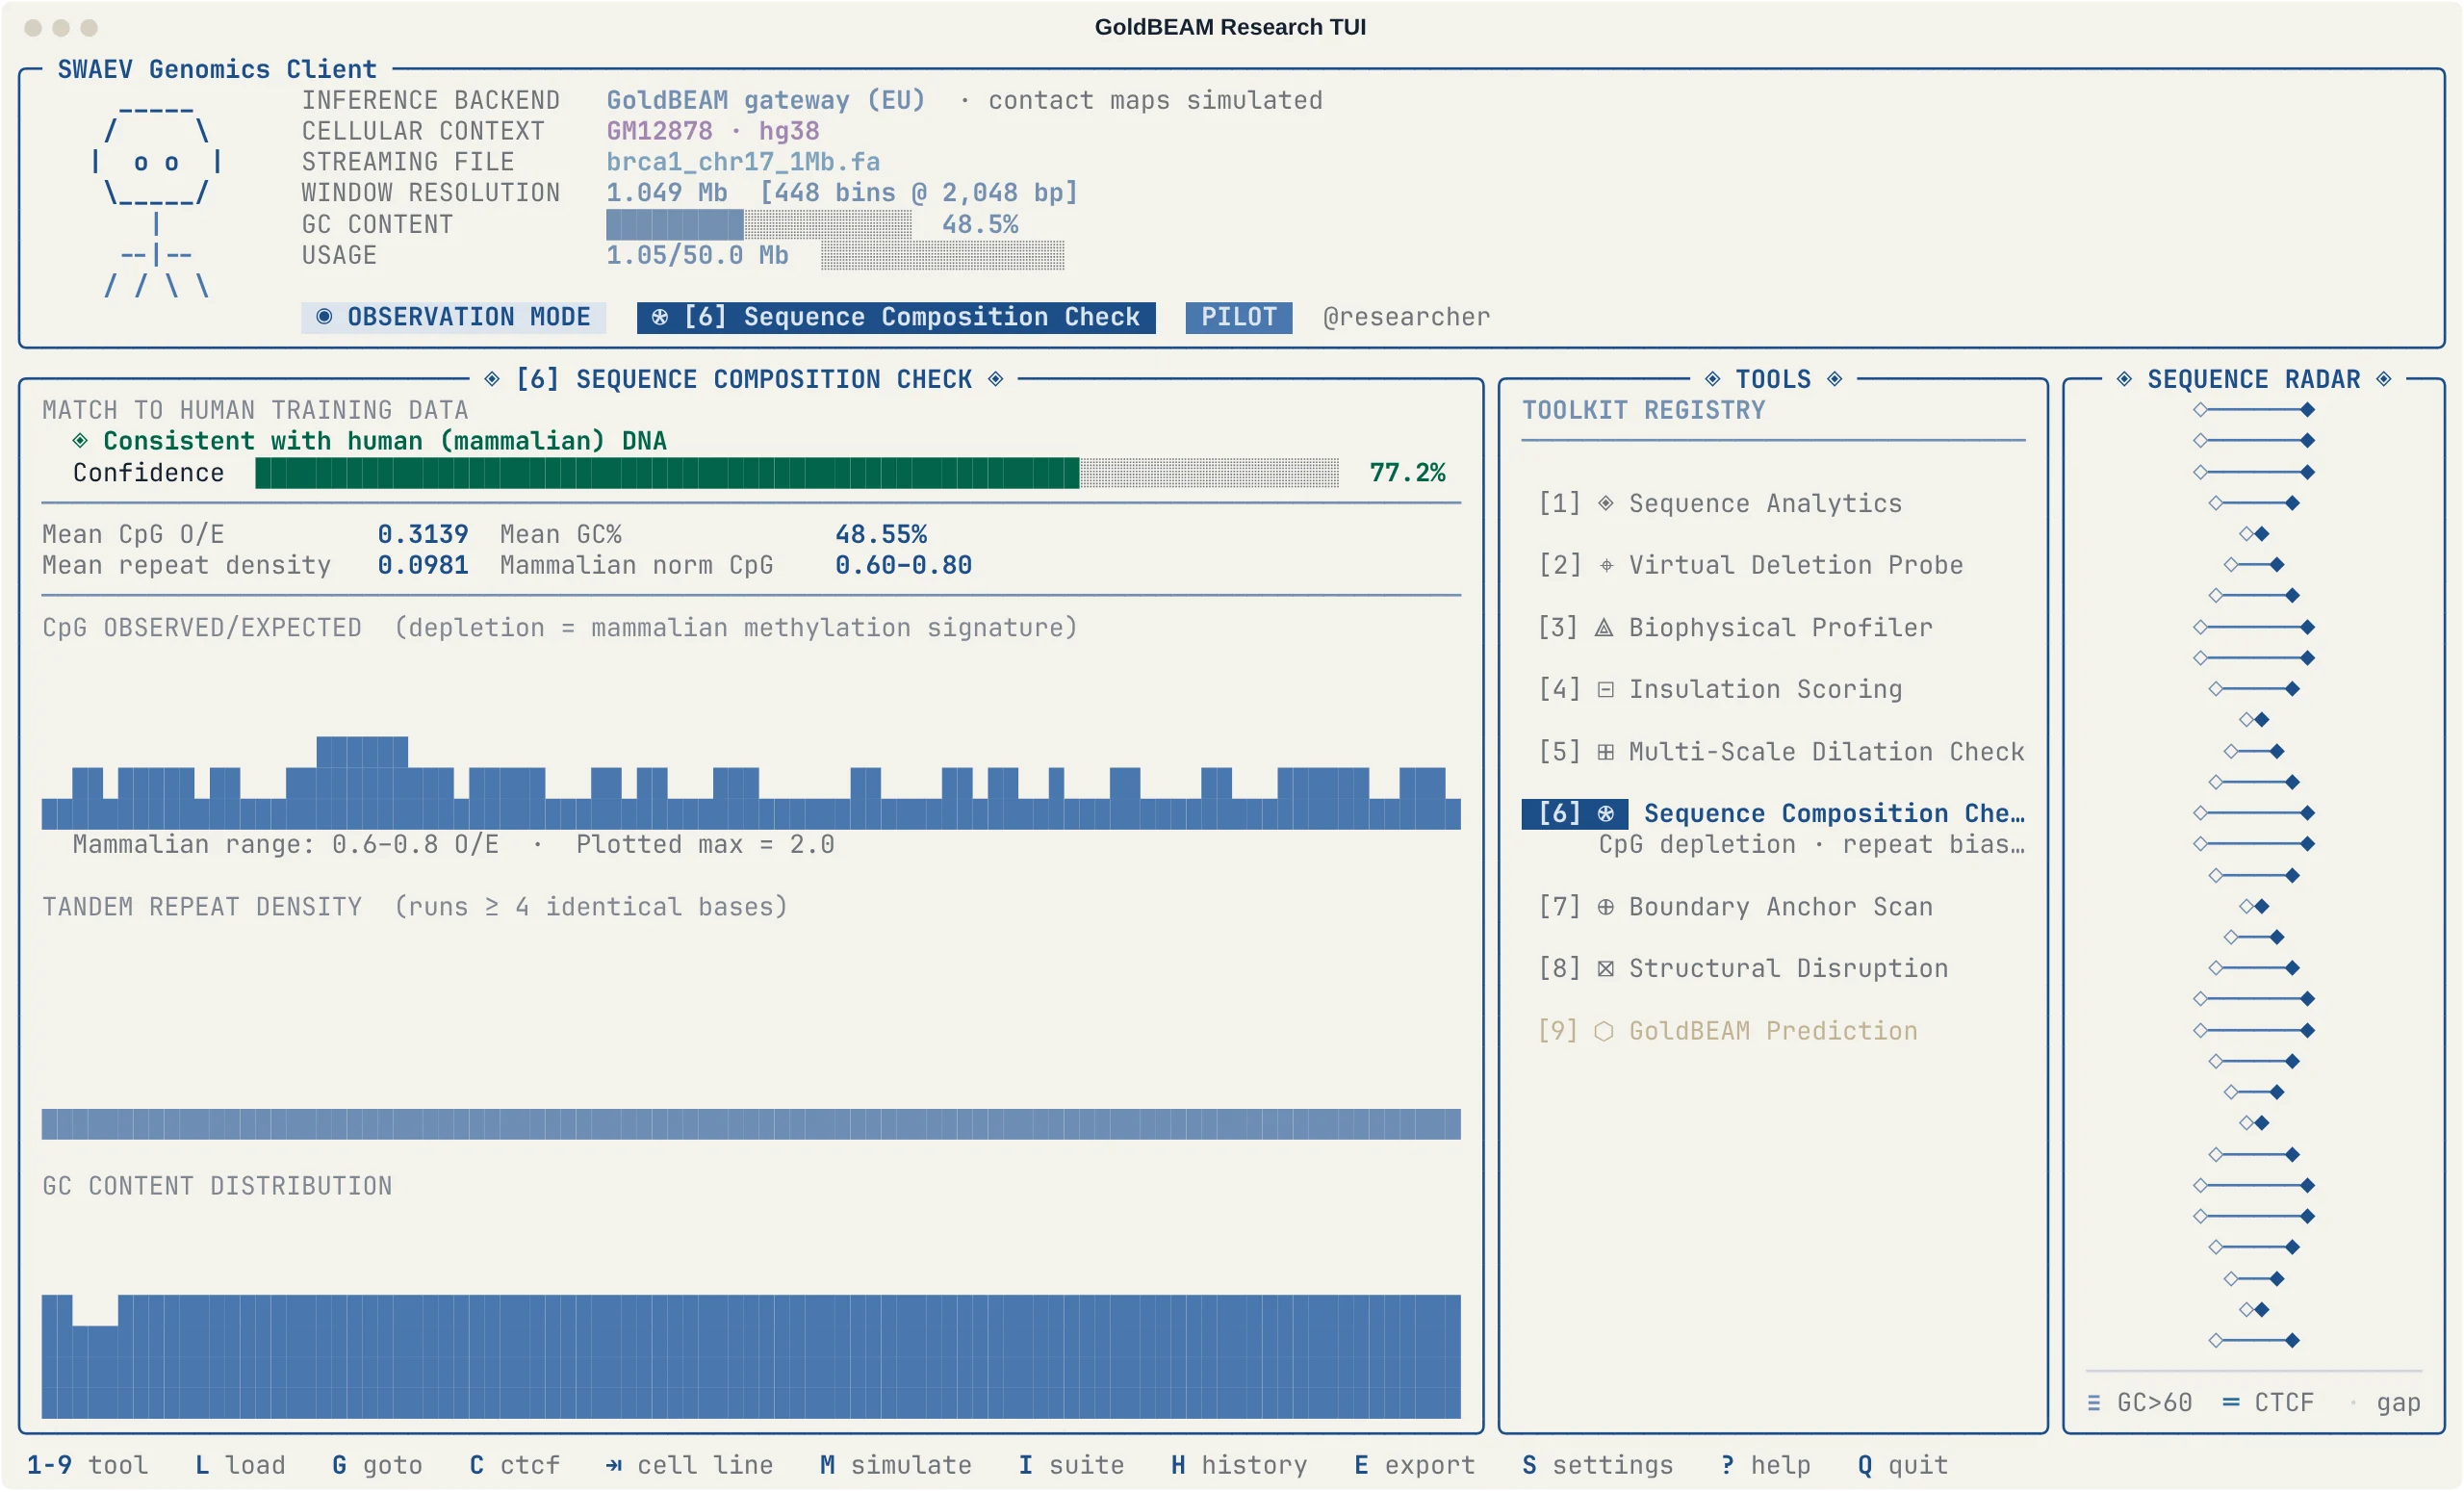
The GoldBEAM TUI ships with nine built-in tools, not just predictions: sequence analytics, biophysical profiling, a composition check against the human training data, virtual CTCF deletion probes, and insulation and boundary scans.
Results export as structured reports and bedGraph tracks you can take straight into your analysis.